What customers say
Solar SunnySolar design and installation · Cincinnati, OH
Serving Cincinnati and nearby towns
Private website concept.
Cincinnati, Ohio
Solar Sunny is a solar installer and performance-check service for Cincinnati homes on Duke Energy Ohio. It would compare what your system makes with what its proposal promised, after weather and age, and put the gap, bill credits and who owes a fix in writing. New installs would get that promise in the contract.
Get your free quoteRun the promise check
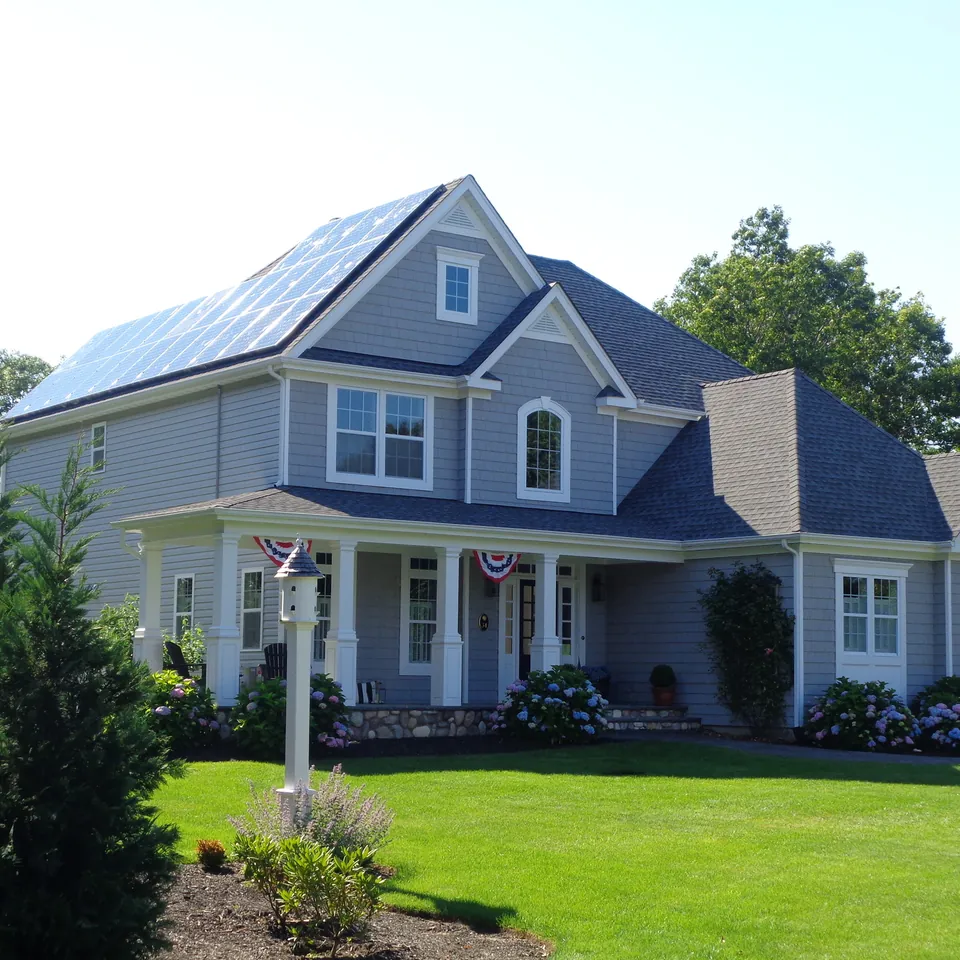
Year 3 of a 7.6 kW systemIllustrative example
86% of the promise
Cincinnati, Ohio
Solar Sunny works across Cincinnati and the Ohio River towns on systems already on a roof. We compare what your array actually made with what the proposal said it would, after weather and age, and put the gap in writing, month by month.
What customers say
Serving Cincinnati and nearby towns
What we do
Call or visit
| Phone | (513) 876-5271Call to book an assessment. |
|---|---|
| Estimates | Free, in writingDesign and price as separate documents. |
Why homeowners pick us
Our story
Serving Cincinnati, Newport, Covington and the surrounding Ohio River towns.
Where we work
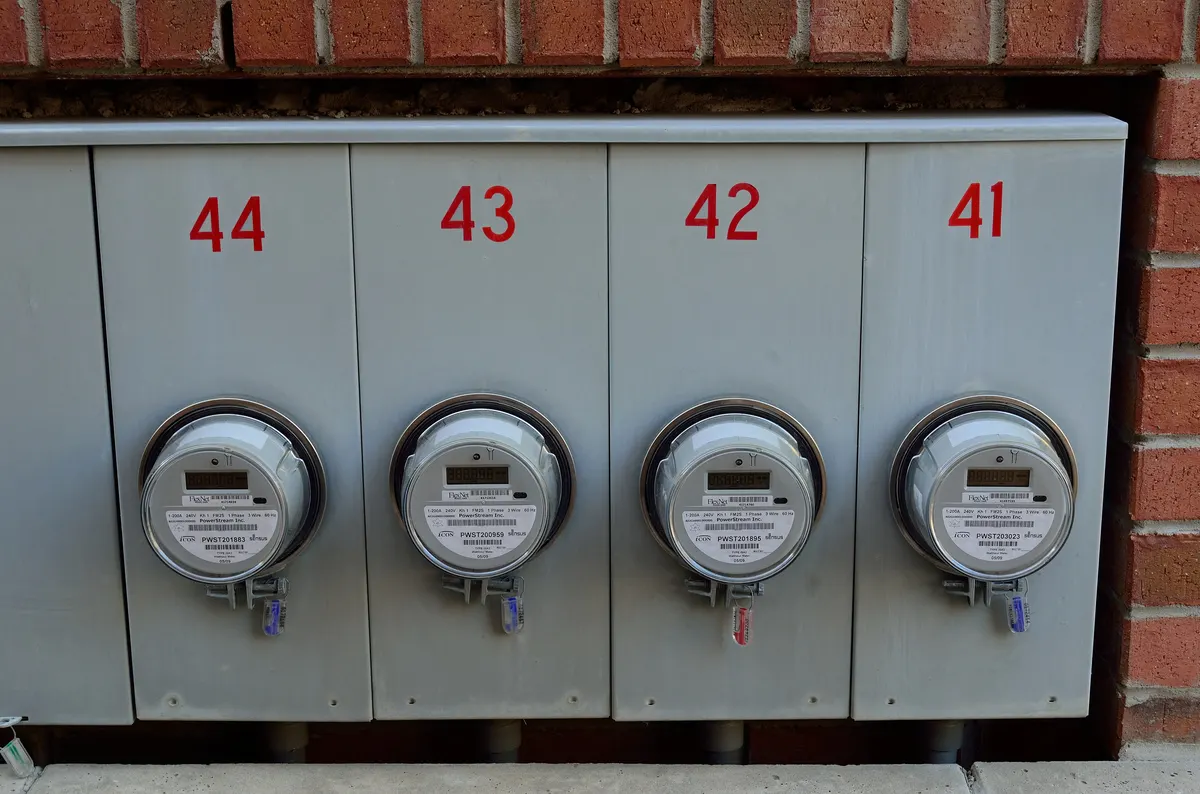
Line A
Send us the original proposal, Duke's approval, your bills and the monitoring export. We rebuild the promise, measure what the system delivered on the same footing, check the bill credits and tell you whether a gap is real.
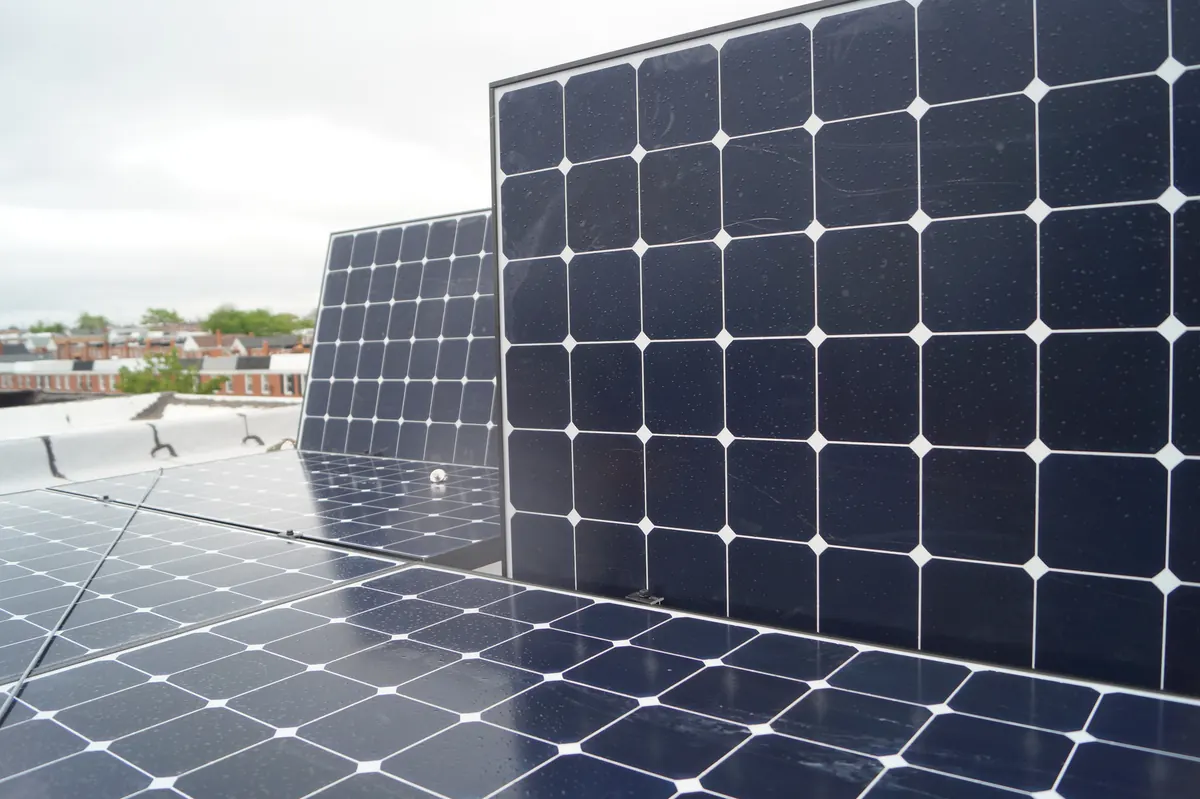
Line B
A new-install quote that states the year-1 kWh, the tool and shade report behind it, the losses and the yearly decline, then books a 12-month production review using the Line A method.
Neither line upgrades or expands a system. A fault we find becomes a line on the fix-and-claim sheet, with the party who pays for it.
Type the numbers from your proposal and your meter. The check lowers the year-1 promise by the decline rate, compares it with what was measured and prices the gap. It runs on this device; nothing is sent or stored.
Illustrative calculation. Benchmark: 1,322 kWh per kW a year, EcoGen's Ohio production factor (modelled at Columbus). Gap value: from Duke's excess credit of 8.1218¢ per kWh (Rider RE as EcoGen reports it for 2026–27) to Ohio's average residential price of 18.41¢ per kWh (EIA, 12 months to August 2026).
From the proposal, e.g. 7.6
The proposal's first-year estimate
Proposal's rate; 0.5 if none stated
Monitoring total, checked against the Duke meter
Year 3 of a 7.6 kW systemIllustrative calculation
86% of the promise
Worth a closer look. Read the monthly pattern before blaming anything: zero-output days point to downtime, a steady gap in sunny months to shade, dirt or a string, a gap that matches a dull year to weather.
Before you call anyone about low output, find the number your system was sold on. Look in the proposal for a year-1 production estimate: the kilowatt-hours the system was expected to make in its first full year. Then put it next to what the system actually made, on the same footing.
Two units do most of the work here. kW (DC) is the system's size, the panels' rated outputs added together; twenty 380-watt panels make 7.6 kW. kWh is energy, what your meter counts and Duke bills. Divide the promised kWh by the kW and you get kWh per kW, a quick read on whether the original model was modest or bold.
Gather four documents first:
Then line up the same months, reduce the promise by the yearly decline the proposal assumed, and check whether the weather was unusually dull. Only then does a gap mean something.
Solar Sunny would offer two lines of work. Both are proposals; scope, prices and terms are not set.
Line A: performance check for a system you already own. You send the four documents. We rebuild the original promise, measure what the system delivered, check the bill credits and say whether a gap is real. It is meant for systems another company designed, sold and installed; that company's proposal and warranty are what the check holds the system to. The remote review would come first and be included. A site visit would follow only if the data points to the roof, such as a string of panels that stops reporting or an inverter fault code. Testing, thermal imaging, cleaning, reconnecting dead monitoring and repair quotes would be optional and quoted separately.
Line B: new install with a checkable promise. The quote would state the year-1 kWh, the tool and shade report behind it, the losses assumed and the yearly decline rate. It would book a 12-month production review using the Line A method. Any production guarantee would come with its remedy and claim steps in writing.
Pick Line A if output or bills look low, or if you can't tell whether the app or the system is wrong. Pick Line B if you're comparing new quotes and want one you can hold to account a year after switch-on.
Neither line upgrades or expands a system. A fault found in Line A becomes an item on the Fix-and-claim sheet, with a named payer, not a sales pitch.
coverage is Cincinnati plus Norwood, Cheviot, North College Hill and Wyoming; none of it is confirmed yet.
The remote review would answer four questions in order. Each answer decides whether the next one is worth asking.
A site visit would be suggested only when those answers point at the roof. It would look at shade growth since install, dirt on the panels, inverter or microinverter fault logs, string checks (a string is a chain of panels wired together), roof penetrations and wire management, and snow or storm damage.
No turnaround is set for the service. On your side, paperwork sets the pace: finding an old proposal or Duke's approval letter can take longer than reading them. Send what you have; a missing document becomes a line in the report, not a reason to stop.
Line B starts before any price. The Department of Energy's homeowner's guide to going solar names roof age, tree cover, size, shape and slope as the things to look at. The City of Cincinnati's solar guidance adds that a south-facing roof with limited shade and a pitch between 20 and 35 degrees suits panels best. If the roof is near the end of its life, ask whether to replace it first, because panels would have to come off for a later roof job. The design that comes out of this check produces the year-1 kWh the contract would state.
"It looks fine" on the phone won't support a claim. We put the result on paper:
The method follows the solar operations and maintenance best practices of the National Laboratory of the Rockies (NLR, published under its former name NREL in 2018, for systems of all sizes): compare measured with predicted output only after allowing for degradation, the slow yearly loss of panel output. The guide uses 0.5% a year as a default when the manufacturer gives no figure. The proposal's own rate wins when it states one.
The guide also separates downtime (was the system producing at all?) from weather-adjusted performance (how well did it produce when the sun was there?). A dead inverter for six weeks is downtime; a system that runs daily but makes less each spring is a performance problem. Different causes often mean different payers, so the report would keep them apart.
Every input here is made up to show the method; only the benchmark and the two prices are real.
| Line | Figure | Label |
|---|---|---|
| System size | 7.6 kW DC | Illustrative example |
| Year-1 promise in a 2023 proposal | 9,690 kWh (1,275 kWh per kW) | Illustrative example |
| Ohio production factor | 1,322 kWh per kW per year | State benchmark, EcoGen, modeled at Columbus |
| Year-3 promise at 0.5% yearly decline | 9,690 × 0.995 × 0.995 ≈ 9,593 kWh | Illustrative calculation |
| Measured year 3, monitoring checked against the Duke meter | 8,240 kWh | Illustrative example |
| Gap | 1,353 kWh; 86% delivered | Illustrative calculation |
| Value of the gap | about $110 to $249 a year | Illustrative calculation |
Start with the promise itself. At 1,275 kWh per kW it sits below EcoGen's statewide 1,322, a figure modeled at Columbus rather than Cincinnati, so it isn't inflated on its face.
The value range comes from two prices. The low end, about $110, uses Duke's excess credit of 8.1218¢ per kWh (the summer rate, also paid on the first 1,000 kWh of a winter month), as EcoGen's Ohio incentives research reports it for 2026–27. The high end, about $249, uses Ohio's average residential price of 18.41¢ per kWh, the EIA 12-month average to August 2026, from EcoGen's Ohio solar cost page. Missing output that would have ended up in a month's net excess is worth only the credit. Missing output that would have covered power you bought that month is worth closer to the full price. A real home lands somewhere between, depending on when it uses power.
Is 86% a fault? Not yet. NLR's PVWatts calculator says its predictions carry inherent uncertainties and shows an expected range built from 30 years of actual weather. One dull year can sit at the bottom of that range with nothing wrong on the roof.
So the report would rank causes by the monthly pattern, not the yearly total:
Against the unadjusted year-1 promise the same output reads 85%. Using the proposal's own decline rate is fairer to the installer and harder for them to dispute.
A bill can look wrong while the panels work fine, because of how Ohio credits exports.
Under Ohio's net-metering rule (OAC 4901:1-10-28, effective April 8, 2024), use and export net out within each monthly billing cycle. A month's net excess becomes a dollar credit at the energy component of the standard service offer (SSO), the generation part of Duke's default price for customers without a supplier. The Public Utilities Commission of Ohio adds that it earns nothing for distribution or transmission. The credit carries forward, Duke needn't pay it out in cash, and it can be lost if you stop taking service, for example when you move.
Before anyone climbs a ladder, check whether this rule explains a bill that looks too high. Solar output first covers what the house is using at that moment. Only what is left over in a month becomes a credit, and the credit is priced at the generation part of the rate, not the full price. A winter month with short days and heavy use can produce a normal-looking bill from a healthy system.
EcoGen's Ohio incentives research reports Duke's credit, Rider RE, as 8.1218¢ per kWh in summer and for the first 1,000 kWh of a winter month, 4.7724¢ above that, for June 2026 to May 2027, plus a written refund request for up to 12 months of credits. We haven't checked this against Duke's filed tariff, so confirm it there.
In Cincinnati, a second company may sit on your bill. The City runs an opt-out electric aggregation: eligible Duke customers are enrolled with a supplier unless they leave, and leaving costs no fee. The City's page listed $0.1044 per kWh for May to November 2026; check the rate after that. PUCO says a CRES supplier (a competitive retail electric service provider, which sells you generation while Duke delivers it) may offer its own net-metering contract. Whether the City's supplier enrolls net-metering homes, and what it credits for net excess, we have not confirmed.
| Who supplies your generation | Who sets the excess credit | What to ask, in writing |
|---|---|---|
| Duke standard service offer | Ohio rule: energy component of the SSO (Rider RE, as EcoGen reports it for 2026–27) | The current Rider RE rate, and how credits carried forward on your last 12 bills |
| City aggregation or another CRES supplier | The supplier's own net-metering contract, if it offers one | Whether you are on a net-metering contract, the credit rate, and whether credits carry forward or expire |
| A rural electric co-op | The co-op; PUCO says co-ops are not required to offer net metering | The co-op's own export terms |
Duke Energy Ohio serves most of Hamilton County, but Butler Rural Electric Co-op also appears in the county's federal utility listing, so check the name at the top of your bill.
This part is for Line B buyers. A new system's price moves with its size, the roof, the electrical work and add-ons such as roof repairs, a panel upgrade or a battery. Cincinnati also requires a stamped structural letter for roof mounts from an Ohio-licensed design professional, so the design work is part of the price even on a simple roof.
To compare a quote with the market, divide the solar-only cash price by the system's DC watts. Strip out roof work, electrical upgrades and any battery first, or the number means nothing.
Illustrative calculation: a solar-only cash quote. A quote offers 8.0 kW DC for $24,000, with no battery and no roof work. $24,000 ÷ 8,000 W = $3.00 per watt. State benchmark: EcoGen Solar Cost Index, September 2026 Edition, $2.77 per watt for Ohio, a modeled installed price before incentives, not a quote. The example quote is 8% above the benchmark and inside EcoGen's $2.44 to $3.10 per-watt quote band. If it promises 10,400 kWh in year 1, that is 1,300 kWh per kW, close to the 1,322 state benchmark.
The Solar Cost Index methodology defines the index as a modeled installed price per watt for a representative home system, before incentives. It is a state figure, not a Cincinnati quote.
Price and promise are separate tests. A quote can be fairly priced and still promise too much; a kWh per kW well above 1,322 deserves questions about shade and losses. And never divide a performance-check fee, a repair or a battery line by $2.77.
The City's solar photovoltaic installation checklist requires a building permit from Buildings & Inspections for every solar installation and recommends applying for it before the electrical permit. Zoning review runs at the same time. The submission includes plans with clearances, the structural letter, an electrical diagram and equipment spec sheets. Keep copies; a Line A check would ask for them years later.
Timing, as of mid-2026: the City aims to review residential solar within 5 business days and lists roof-top solar as a Tier 2 review. It offers same-day review for in-person submissions for almost all residential solar; treat that as typical, not guaranteed. A project in the floodplain moves automatically to Tier 3 review. These details come from City pages dated June to October 2026, so confirm them with Buildings & Inspections before you plan around them. Neighboring cities run their own routes; Norwood takes permit applications in person only.
The electrical permit comes from Inspection Bureau, Inc. (IBI), not City Hall. Since September 14, 2026, IBI takes Ohio electrical permit and plan-review applications through CAGIS ezTrak, and its notice for solar PV systems asks submitters to contact IBI before applying.
Two checks fall on you:
A Line A check needs no permit. A repair that replaces an inverter or rewires strings is electrical work; ask IBI whether a like-for-like swap needs a permit before the work starts.
Ask the installer for a date and an owner for each step.
Settle who pays for what while everyone is still friendly.
On the Fix-and-claim sheet, each item would name one payer: the original installer, the manufacturer or you. A weak weather year is no one's fault, and only a production guarantee's own terms decide whether it counts against one.
If you're comparing solar installers in Cincinnati, OH, bring these to every quote; the quote checklist on this site follows the same order.
Two red flags deserve a firm no. A payback figure that counts a 30% federal tax credit for a 2026 purchase: the IRS states that the Residential Clean Energy Credit is not available for property placed in service after December 31, 2025. And a quote that promises savings but no kWh, because savings depend on rates you can't control while kWh is the one number the installer can be held to.
No. A dull year can sit at the low end of PVWatts' weather range. Zero-production days point to a fault; an even shortfall in a sunny year points to shade, soiling or the original model.
Not by itself. Compare each winter month with the proposal's estimate for the same month, if it gives one, not with summer. A winter month well below its own estimate, in a normal-weather year, is worth a look; a winter month below July is just winter.
Not for systems placed in service after December 31, 2025, per the IRS. An older proposal's payback may have assumed it; that's separate from whether the system makes its promised kWh.
Check the app against the meter. On a solar-only system, every kWh Duke's meter records as received from you passed through the inverter first, so the app's production for the same period should never be lower than your exports. Match the bill's meter-read dates before comparing. If production is still lower, the monitoring is undercounting, not the panels.
Each guide covers the local rule that changes the decision: the permit office, the utility on the bill, a historic district.
Pick your town and the line of work. The site builds a checklist to bring to a quote or a performance check. It runs on this device: nothing is sent or stored, and there is no form to submit.